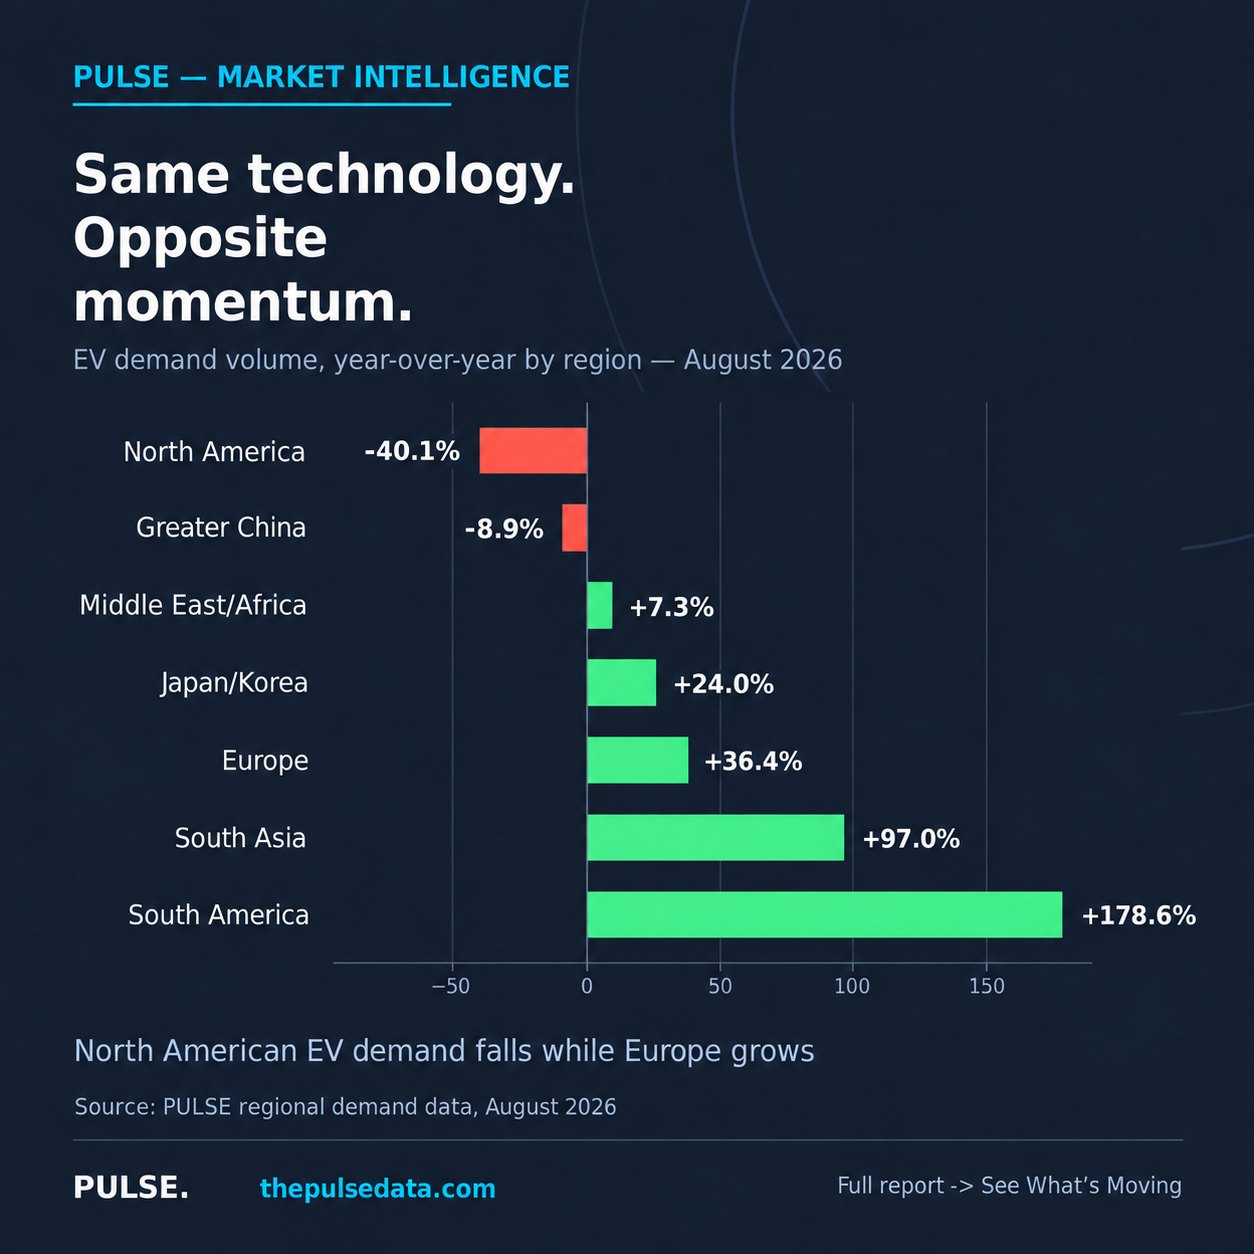
Same technology. Opposite momentum.
The signalAugust EV demand: North America −40.1% year on year, Europe +36.4%.
2 min read→
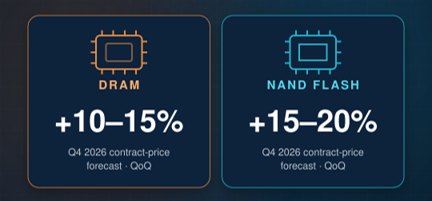
Which chips are driving the electronics bill?
The signalDRAM contract prices are forecast +10–15% and NAND +15–20% in Q4 2026 — but chip prices are not moving together.
5 min read→
AI can help build your budget. Can you defend its assumptions?
The signal71% of finance leaders would reject a 99%-accurate AI tool that cannot explain its answers.
3 min read→
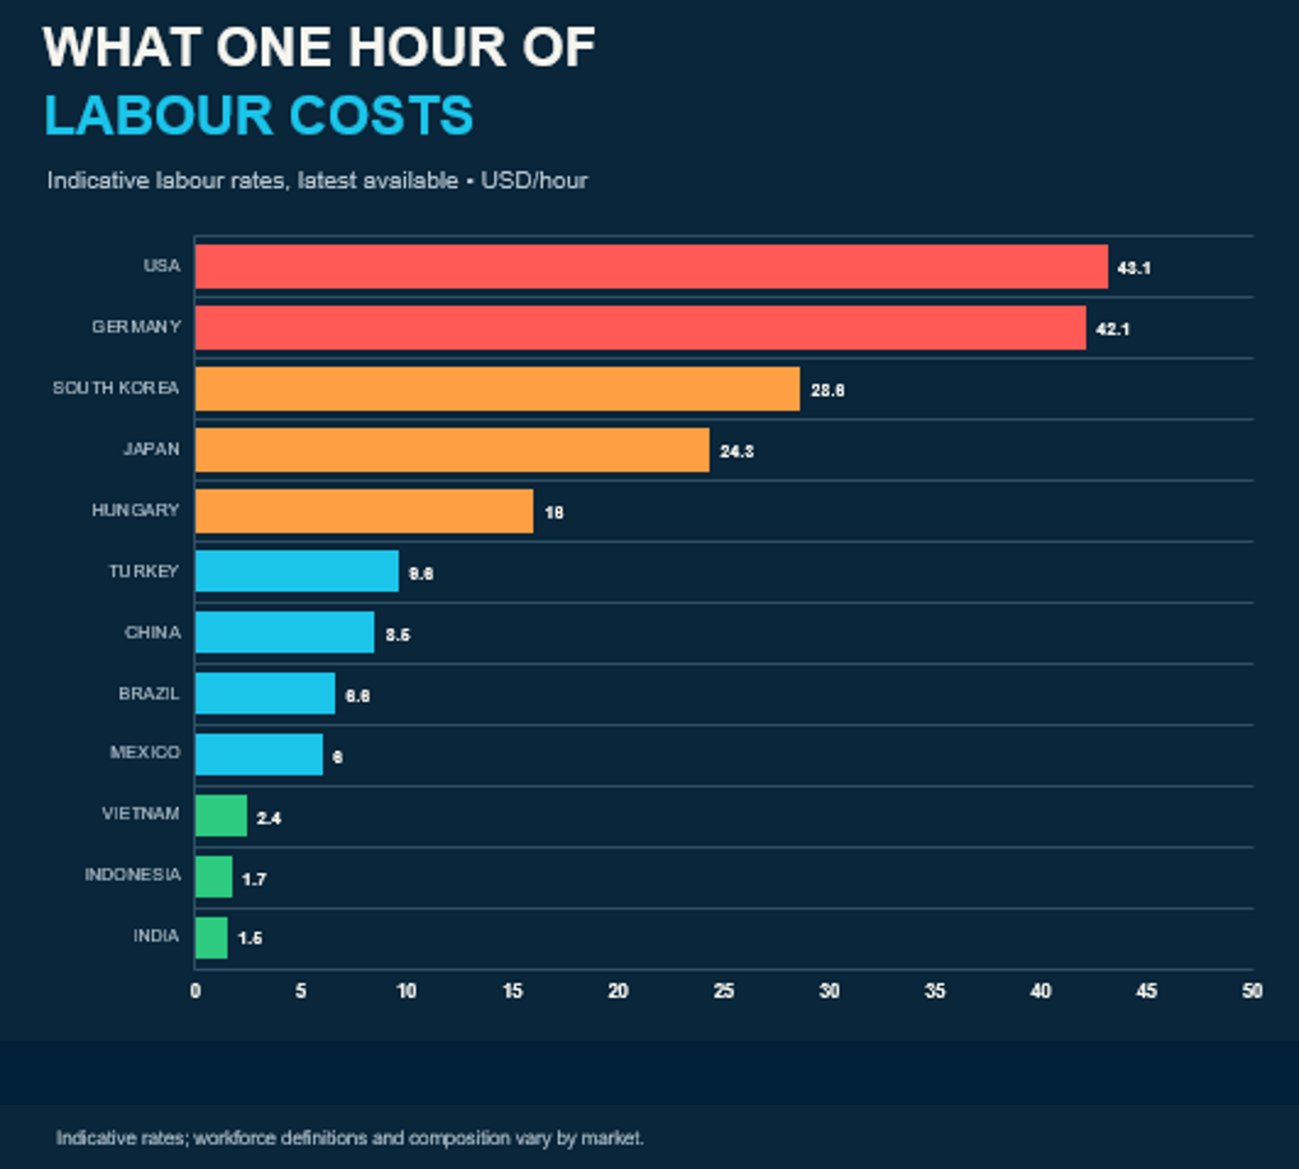
Automotive labour costs: the gap remains wide—but lower-cost markets are moving
The signalOne hour of labour costs ~$43 in the US and Germany versus under $2 in India — but low-cost markets are moving fast.
5 min read→
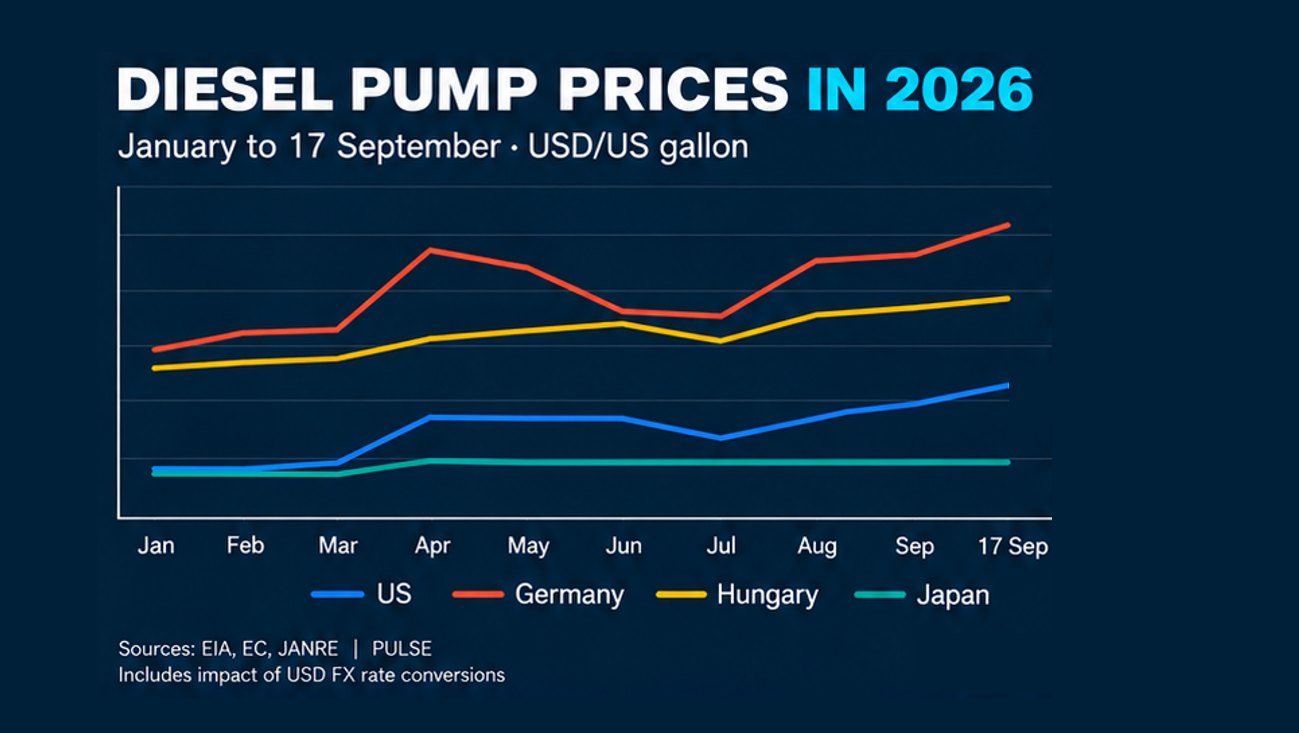
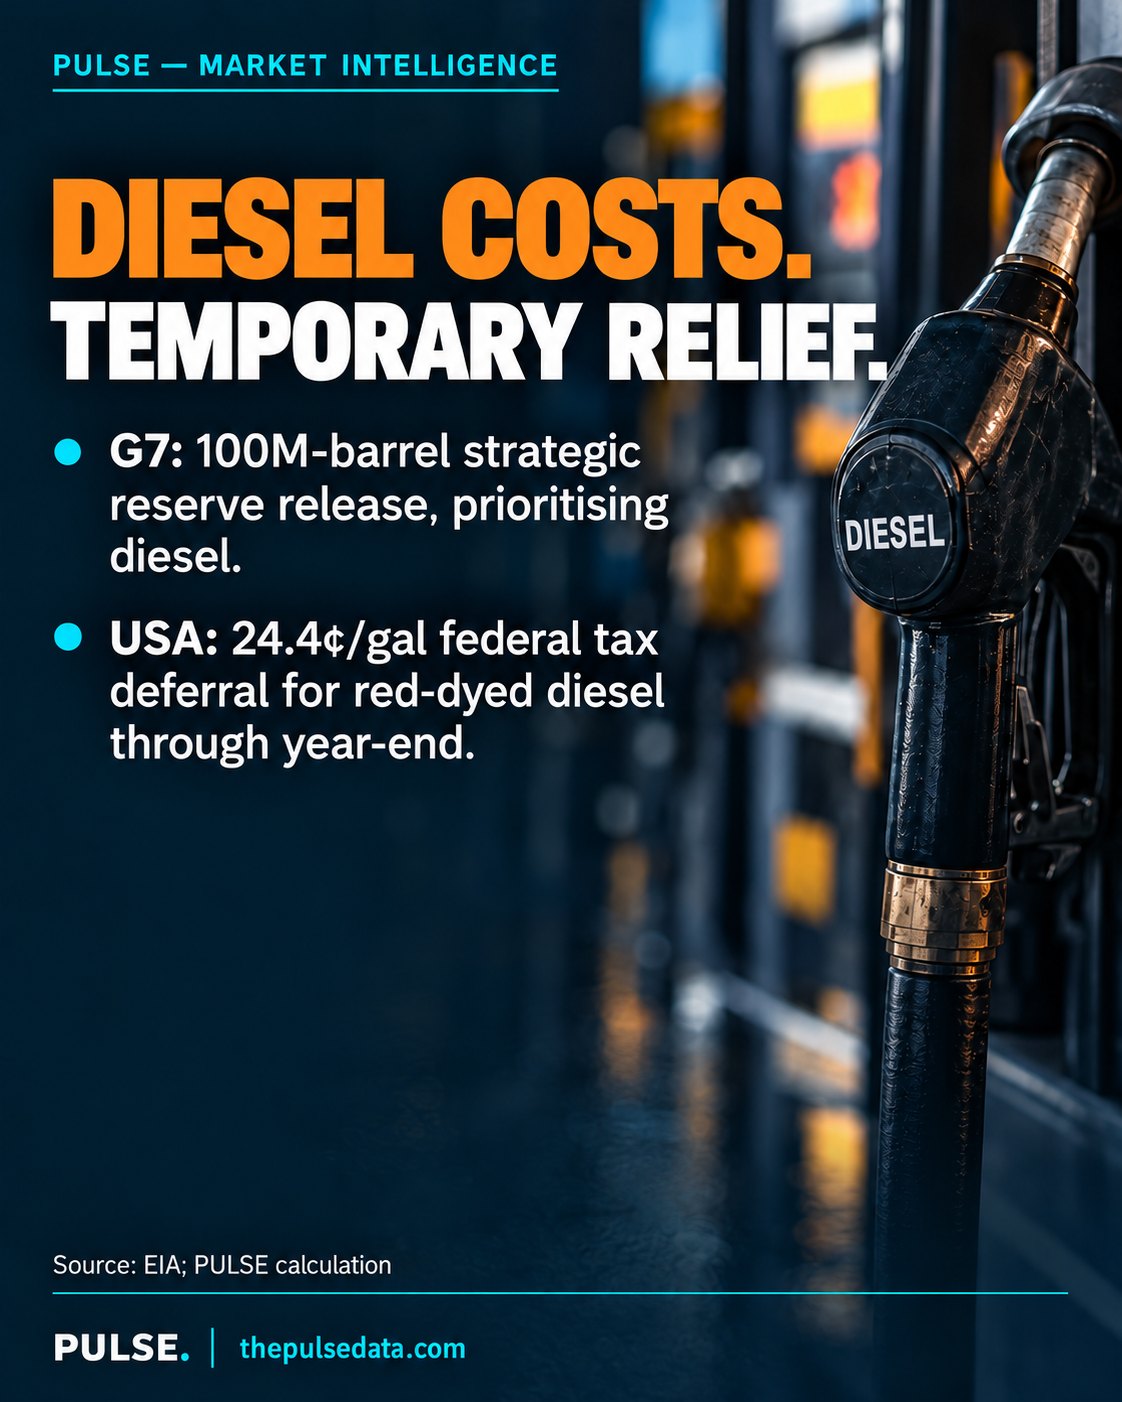
Diesel costs: how much temporary relief belongs in a 2027 budget?
The signalReserve releases and tax relief ease near-term diesel costs — they do not fix the underlying supply squeeze.
4 min read→
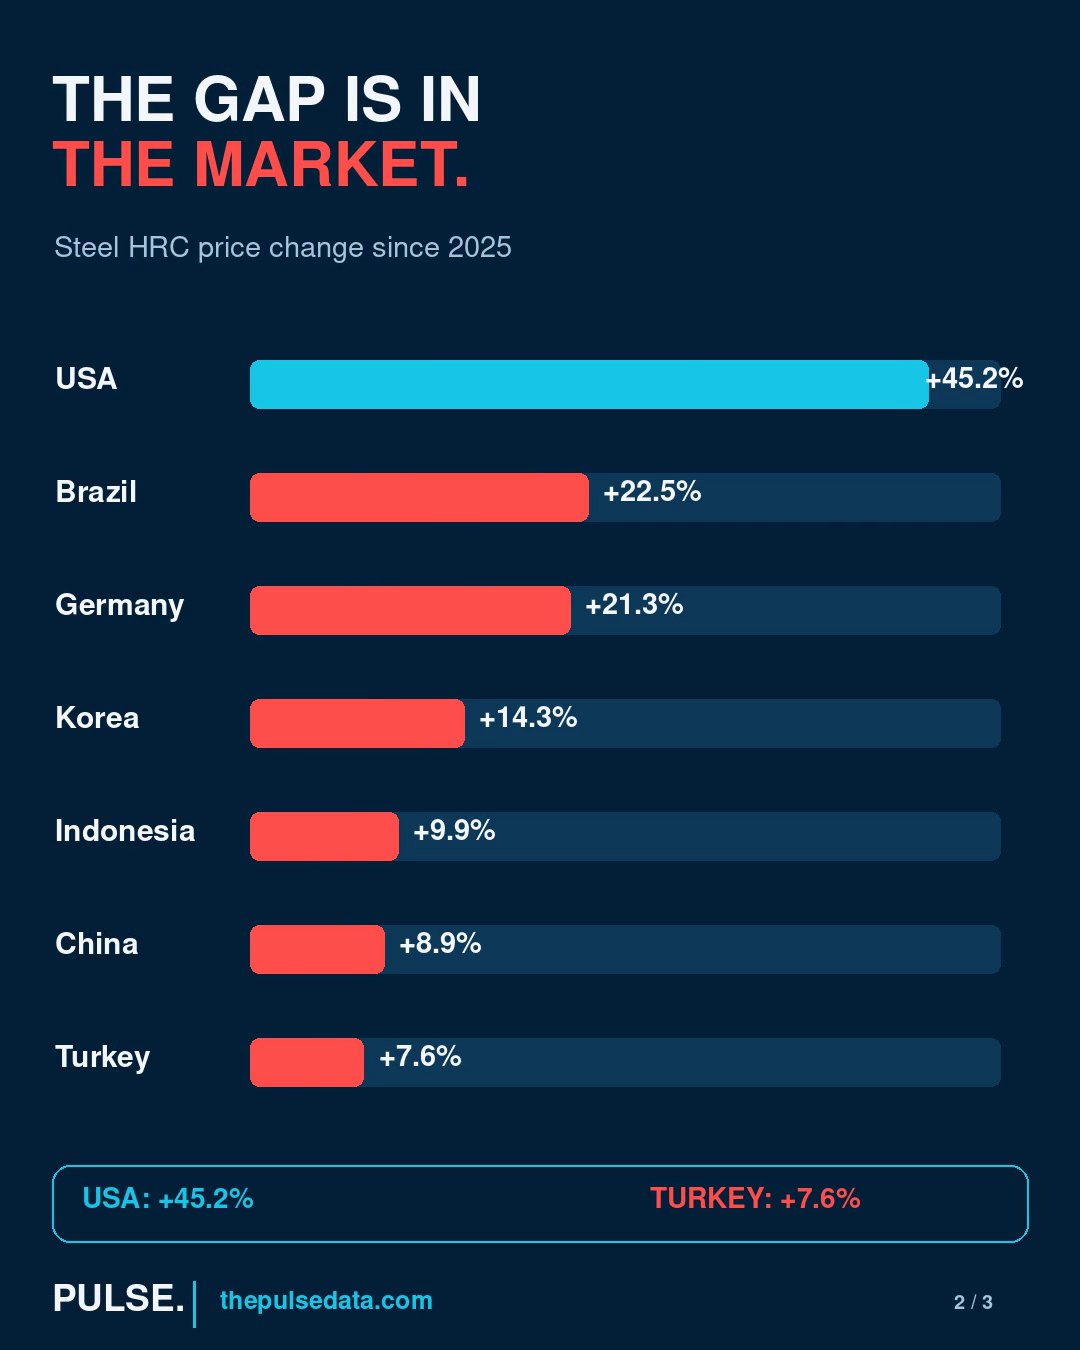
Same steel. A different cost pressure.
The signalUS HRC steel is up 45.2% since the 2025 baseline — almost six times the 7.6% rise in Turkey.
3 min read→
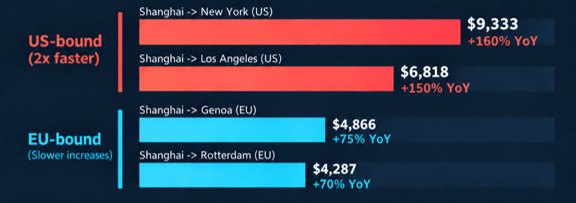
Container freight costs are diverging: why one global rate no longer tells the story
The signalChina–US container rates are up ~150–160%; routes into Rotterdam and Genoa have moved far less.
6 min read→
No article matches your search.
Archive
Every PULSE Insight, month by month.
7 analyses
- EV demandSame technology. Opposite momentum.
- ElectronicsWhich chips are driving the electronics bill?
- PlanningAI can help build your budget. Can you defend its assumptions?
- LabourAutomotive labour costs: the gap remains wide—but lower-cost markets are moving
- EnergyDiesel costs: how much temporary relief belongs in a 2027 budget?
- Raw materialsSame steel. A different cost pressure.
- LogisticsContainer freight costs are diverging: why one global rate no longer tells the story