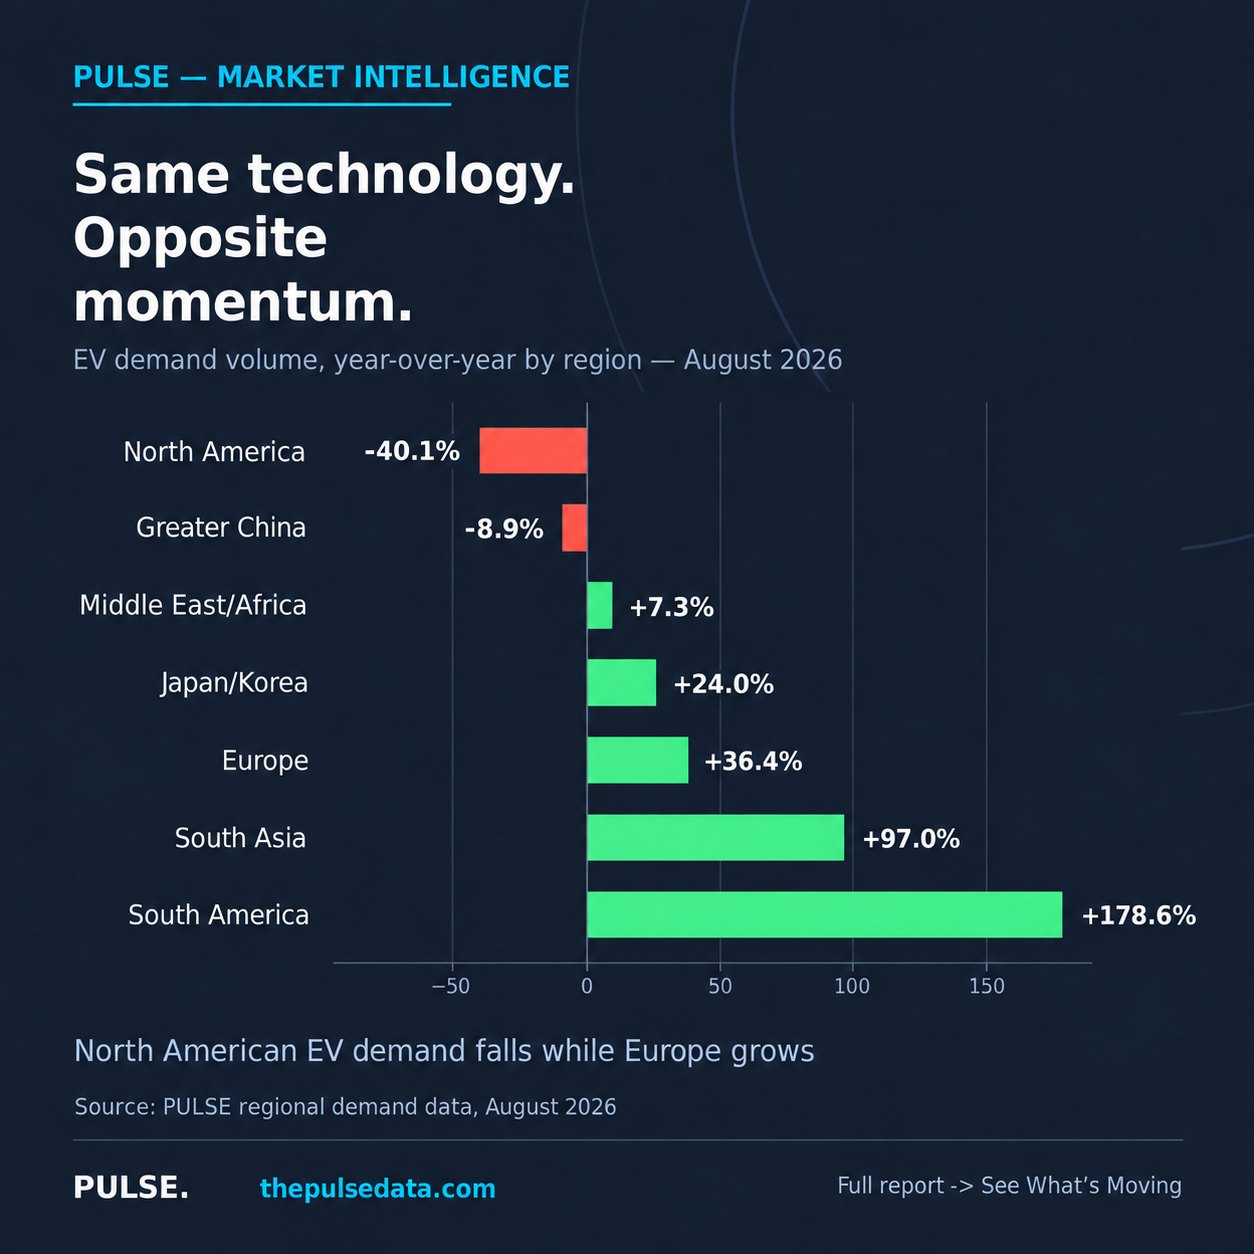
PULSE’s August 2026 regional demand figures show North America down 40.1% year-on-year, while Europe grew 36.4%. South Asia and South America recorded even faster percentage growth, while Greater China declined.
For manufacturers and suppliers, that divergence raises a practical question: where should the next unit of production capacity, investment or commercial effort go?
The comparison needs context
A sharp annual decline does not necessarily mean demand fell equally sharply in the latest month.
In the United States, buyers brought purchases forward in August and September 2025 before federal EV tax credits expired. This created a high comparison base for 2026. Benchmark reports that US EV sales actually increased modestly month-on-month in August, despite the steep annual decline.
That distinction matters when planning production. A market facing an unusually strong prior-year comparison requires a different response from one experiencing a fresh deterioration in demand.
Europe offers growth, alongside competitive pressure
Europe’s growth reflects a combination of purchase incentives, more affordable models and higher fuel prices in several markets. These factors are helping sustain demand, although monthly sales remain affected by seasonality.
However, a growing market does not guarantee improving margins.
Manufacturers still need to assess which vehicle segments are expanding, how much pricing support buyers require and whether their products can compete profitably. Higher volumes can improve factory utilisation, but discounts and a changing sales mix can absorb part of that benefit.
For suppliers, the opportunity depends on which manufacturers and platforms capture the growth.
China’s domestic market is only part of the story
PULSE’s figures show Greater China demand down 8.9% year-on-year in August. Yet weaker domestic demand can coexist with stronger overseas competition.
Benchmark reports that Chinese manufacturers continued to expand exports as domestic demand softened. That makes China relevant to European market strategy through both local demand and the vehicles competing for customers abroad.
A regional sales chart therefore needs to be read alongside production locations and trade flows.
Fast growth needs a volume check
South America’s 178.6% growth and South Asia’s 97.0% growth stand out. Their August demand volumes in the PULSE dataset were approximately 65,000 and 126,000 vehicles respectively, compared with 387,000 in Europe.
Percentage growth highlights momentum. Absolute volume helps establish the scale of the opportunity.
What this means for planning
The August split supports a more regional approach to EV planning. Demand assumptions should account for local policy, comparison effects and competitive conditions. Procurement forecasts should also reflect where vehicles will be produced, rather than relying solely on where they will be sold.
A useful question for the next budget review is:
Which regional demand assumptions underpin our production plan, and what would make us change them?
PULSE tracks EV demand region by region, every month, alongside battery economics and production costs.