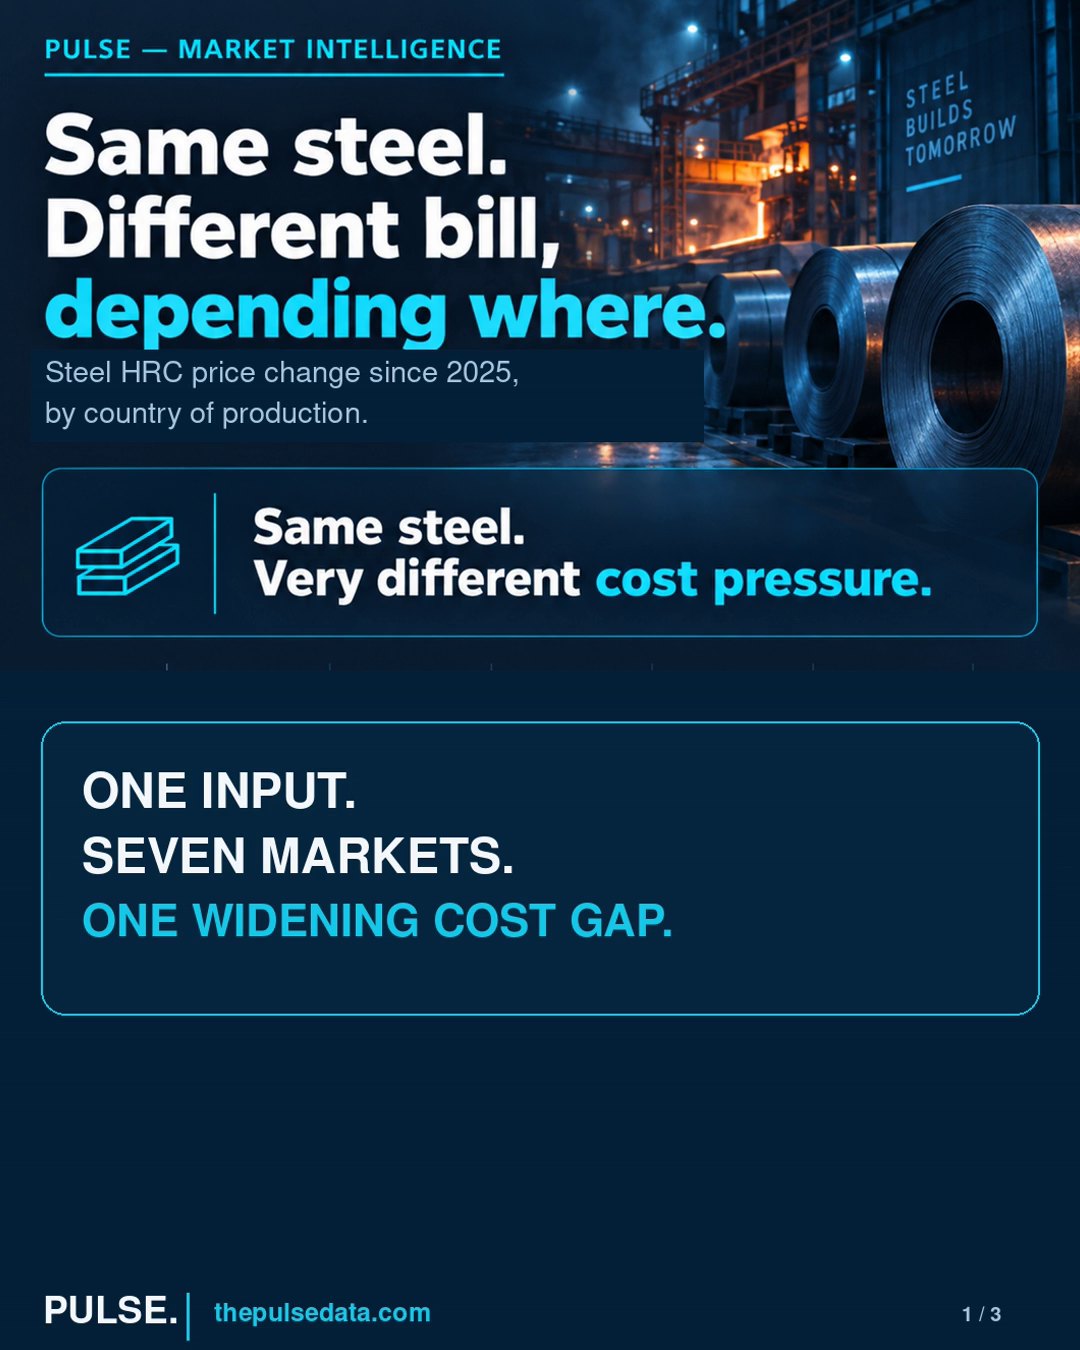
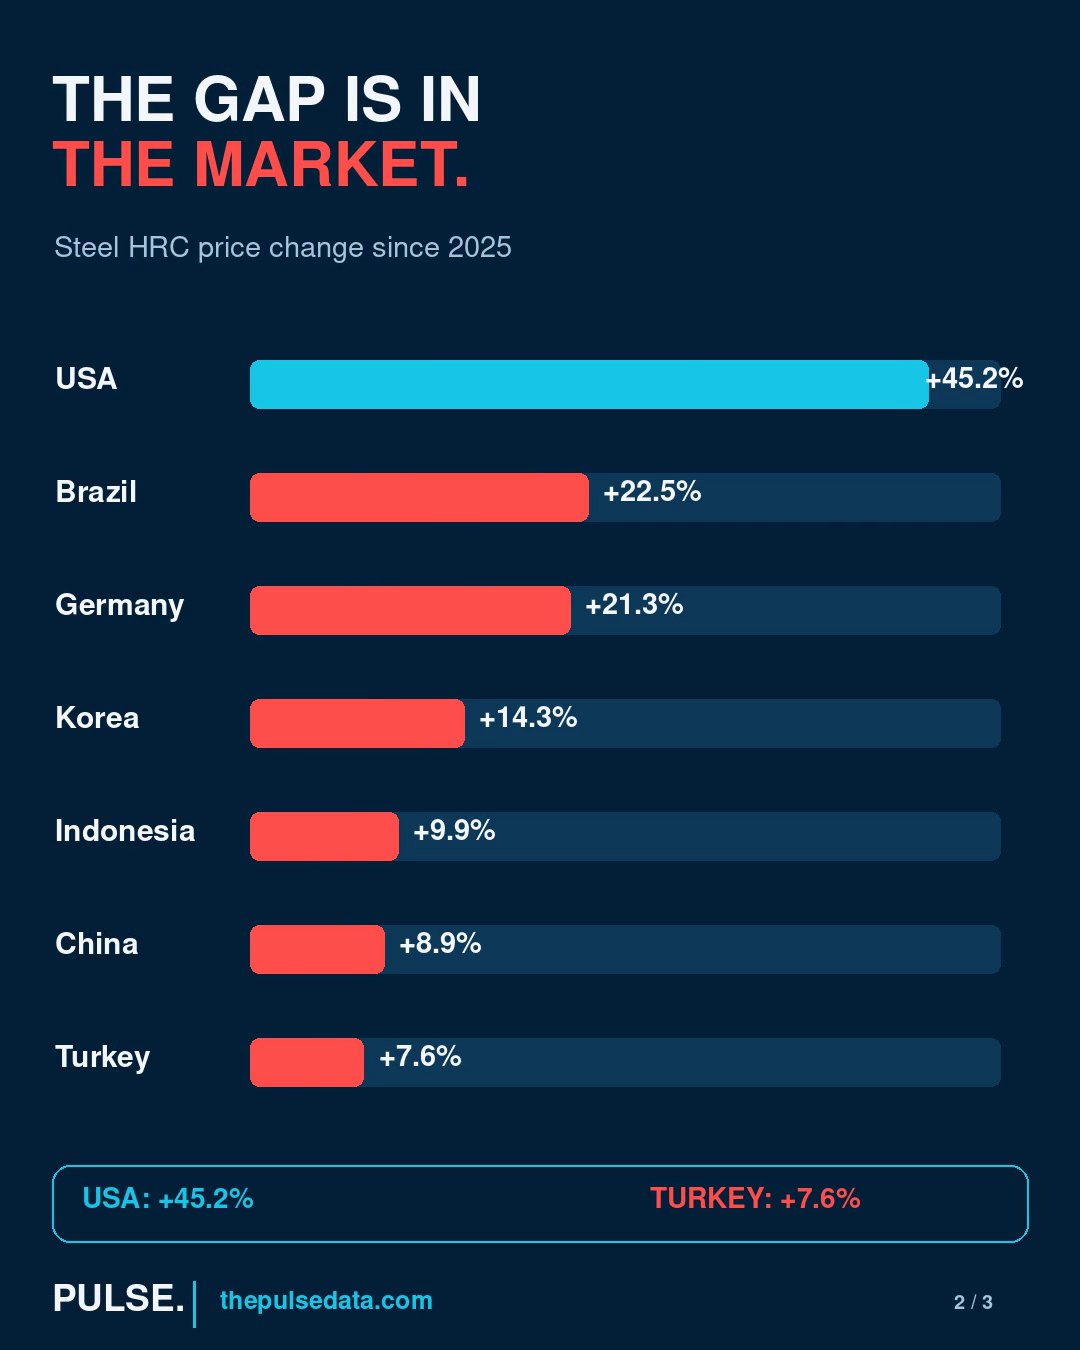
PULSE’s hot-rolled coil (HRC) steel data shows US prices rising 45.2% relative to the 2025 baseline, compared with 7.6% in Turkey. Brazil and Germany recorded increases of 22.5% and 21.3%, while South Korea, Indonesia and China saw smaller rises.
For manufacturers, that divergence raises a practical question: how well do the steel assumptions in your budget reflect the markets supplying your factories and components?
Six times the increase, not six times the price
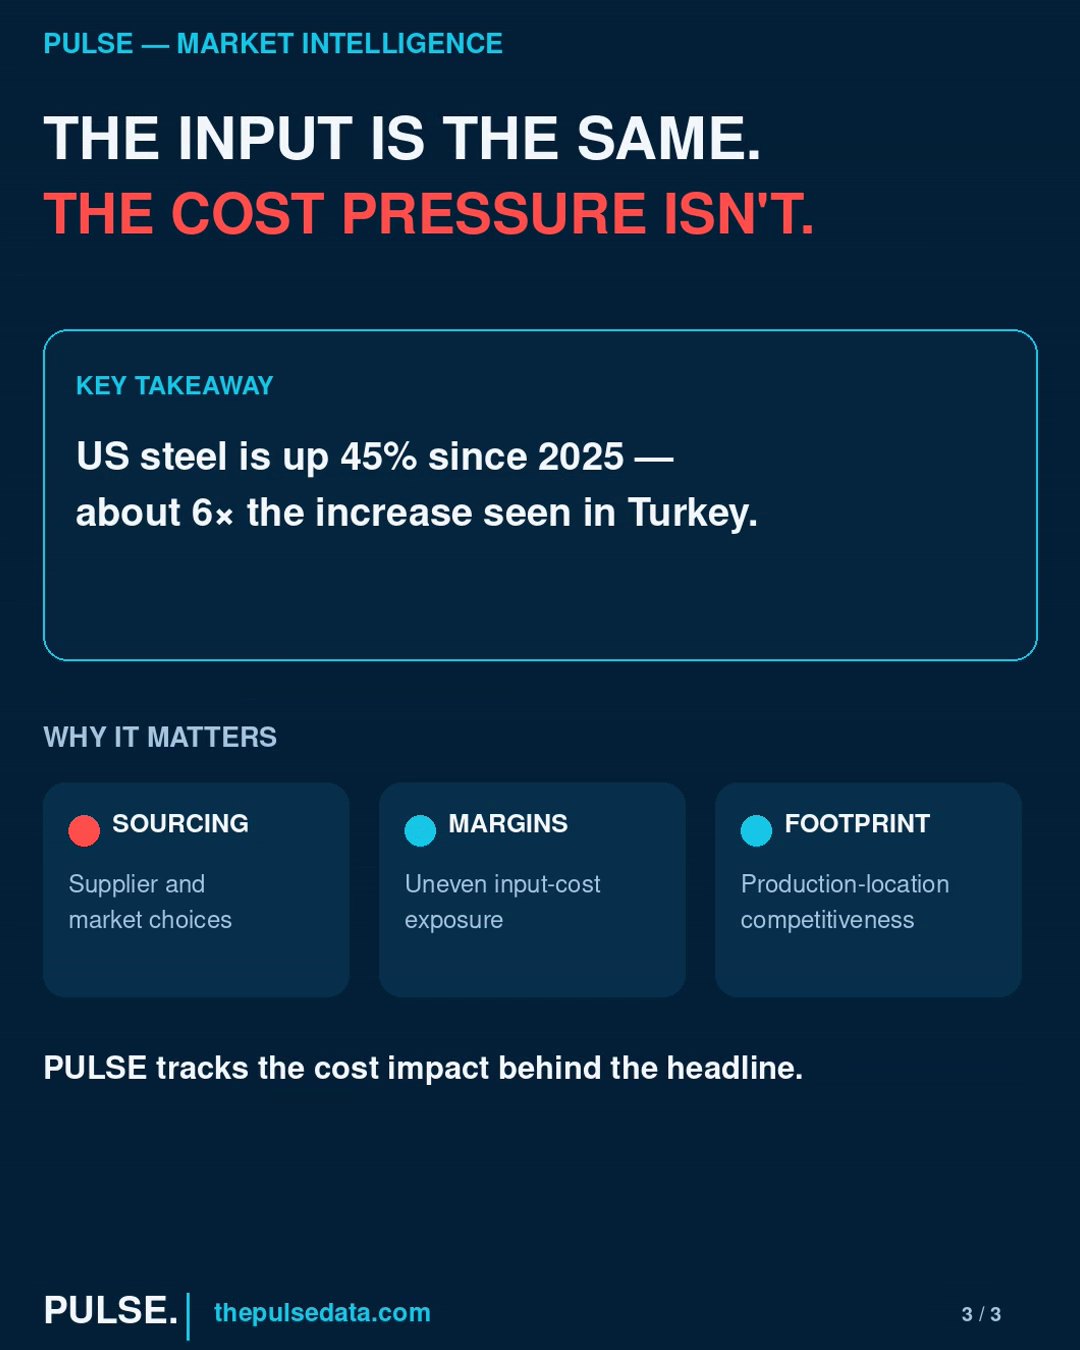
The US percentage increase was almost six times Turkey’s. That does not mean US steel costs six times as much.
A price-change chart measures movement from each market’s starting point. It does not establish the absolute price gap between countries. To compare purchasing costs, buyers also need prices on a consistent basis, including currency, grade, delivery terms and timing.
The chart does establish that these markets experienced very different rates of cost escalation. Applying one global steel inflation assumption would obscure that difference.
Why steel markets can move apart
Steel trades internationally, but local buyers face different market conditions. Import barriers influence access to competing supply, while demand and available mill capacity affect suppliers’ pricing power. Energy costs and exchange rates can further change the economics of production and purchasing.
Trade policy provides a concrete example. In June 2025, the United States raised Section 232 steel import tariffs from 25% to 50% for most origins. That changed the competitive conditions facing imported steel. It provides context for regional divergence, although the PULSE chart alone cannot establish how much of the US price increase came from tariffs.
What reaches the bill of materials?
A benchmark increase creates cost exposure. The timing and size of the impact depend on purchasing arrangements.
A manufacturer buying steel directly may see changes through contract resets or spot purchases. A company buying stamped parts may encounter them through supplier surcharge requests. Fixed-price agreements and inventory can delay the effect.
The steel increase also applies to the exposed material portion of a component, rather than its entire cost.
As a simplified illustration, if steel represents 30% of a component’s cost, a 20% steel-price rise would add approximately 6% to the component cost if fully passed through, with all other costs unchanged.
Understanding that exposure helps purchasing teams assess whether a supplier’s requested increase is proportionate.
Compare the delivered cost
A market with slower price growth is worth investigating, but the chart alone does not justify switching suppliers.
The relevant comparison is the cost of qualified material delivered to the production site. Freight and duties can absorb an apparent saving. Qualification requirements, lead times and supply reliability also affect whether an alternative source is commercially useful.
Regional price tracking therefore supports both sourcing reviews and negotiations with existing suppliers.
A better question for the budget review
Instead of asking only whether steel prices are rising, ask:
Which steel market are we exposed to, and how much of its price movement will reach our costs?
PULSE tracks steel prices country by country, every week, helping manufacturers assess regional cost pressure and keep purchasing assumptions current.