The global average is hiding a regional divide
Container-freight markets are often discussed as though shipping costs were moving in one common direction.
The latest route data show a more complicated picture. Rates from China to the United States have risen sharply, with New York increasing by approximately 160% and Los Angeles by around 150% over the comparison period. Routes into Rotterdam and Genoa recorded much more moderate movements.
This is not simply a difference between two destination ports. It reflects how demand, shipping capacity, transit routes, carrier decisions and disruption can combine differently across individual trade lanes.
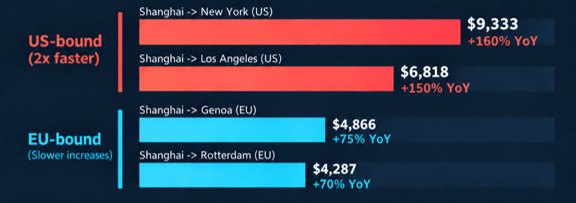
For manufacturers sourcing components, materials or equipment from Asia, the implication is clear: a broad assumption for “ocean-freight inflation” may significantly understate exposure on one route while overstating it on another.
Why have US routes risen more strongly?
Several factors can contribute to the divergence.
1. Demand is not moving evenly
Changes in US import demand can produce a relatively rapid effect on transpacific and China–US East Coast rates.
Importers may bring orders forward in anticipation of tariffs, port fees, policy changes, labour disruption or seasonal congestion. This front-loading concentrates demand into a shorter period, placing pressure on vessel space even if final consumer demand has not increased to the same extent.
Where multiple importers act for the same reason, a precaution taken by individual businesses can become a broader market movement.
2. Capacity is actively managed
Available vessel capacity is not fixed.
Carriers can cancel scheduled sailings—commonly known as blank sailings—change vessel size, adjust port calls or redeploy ships between routes. These decisions help carriers balance supply against expected demand, but they can also tighten the amount of space available to shippers.
A route may therefore experience rising freight rates even where total global container capacity appears sufficient. The relevant question is how much usable capacity is available on the specific sailing and route required.
3. Route disruption has an uneven impact
Geopolitical and operational disruption does not affect every trade lane in the same way.
Red Sea insecurity, conditions around the Strait of Hormuz and constraints affecting the Panama Canal can change voyage length, fuel consumption, insurance costs and schedule reliability. Their effects depend on the origin, destination and routing selected by the carrier.
A China–Los Angeles shipment primarily crosses the Pacific. A China–New York service may use the Panama Canal, the Suez route or an intermodal alternative. A China–Europe service faces a different combination of routing and disruption risks.
Consequently, the same international event can affect one destination materially while having a limited or delayed effect on another.
Europe’s softer rates do not mean an absence of risk
The more moderate development on routes into Rotterdam and Genoa should not automatically be interpreted as a stable long-term outlook.
European rates can remain relatively subdued when demand is soft or sufficient capacity is available, even while carriers face longer voyages or higher operating costs. If capacity is subsequently withdrawn, demand strengthens or disruption intensifies, those underlying pressures may become more visible in freight rates.
There is also a difference between the rate quoted for port-to-port transport and the full logistics cost incurred by the customer.
The delivered cost can include:
- fuel and security surcharges;
- terminal-handling charges;
- demurrage and detention;
- inland haulage or rail transport;
- additional inventory held against delays;
- premium freight used to recover lost time;
- insurance and financing costs.
A stable ocean rate can therefore coexist with an increase in the total cost or working-capital requirement of the supply chain.
Spot rates are a signal—not the price paid by every shipper
Freight indices normally reflect market quotations or spot-market conditions. They should not be interpreted as the price paid by every manufacturer.
Large automotive companies and major suppliers may operate under annual or multi-year contracts with negotiated rates, volume commitments and surcharge mechanisms. Smaller shippers, or those requiring capacity at short notice, may have much greater exposure to the spot market.
Nevertheless, spot-rate movements remain important because they:
- indicate changes in the balance between supply and demand;
- influence forthcoming contract negotiations;
- affect shipments outside committed volumes;
- provide a signal of carrier pricing power;
- help identify routes facing increasing disruption or capacity pressure.
The timing and magnitude of the pass-through will differ, but the market signal should not be ignored.
The production-cost impact extends beyond freight
Higher container rates affect the landed cost of imported materials, components, tooling and production equipment.
The effect is greatest where products are bulky, heavy or relatively low in value. For high-value compact components, freight may represent a smaller proportion of delivered cost. For larger components or lower-value materials, a sharp increase in shipping cost can have a much more visible impact.
Disruption also creates indirect costs. Longer or less reliable transit times may require:
- additional safety stock;
- earlier ordering;
- alternative suppliers;
- changes in production scheduling;
- air freight or other expedited transport;
- greater working capital.
The cost of a disrupted route is therefore not limited to the freight invoice.
A route-level approach to logistics budgeting
Manufacturers should avoid applying one global percentage increase to all international logistics expenditure.
A stronger budgeting approach separates exposure by:
- origin and destination;
- shipping route and port combination;
- transport mode;
- contractual versus spot-market volume;
- component type and freight intensity;
- exposure to surcharges and inland transport;
- operational consequences of longer or less reliable transit times.
At a minimum, budgets should distinguish between major China–US, China–Europe and intra-regional flows. Where alternative ports or routes are available, their total landed costs should be compared rather than evaluating the ocean rate in isolation.
Scenario analysis can then test the effect of:
- a temporary demand-driven rate increase;
- sustained capacity reductions;
- further route disruption;
- a return to more normal market conditions.
The planning conclusion
The recent increase in China–US freight rates does not represent a uniform rise in global shipping costs. It is part of a more fragmented market in which individual routes can move in different directions and at very different speeds.
For automotive manufacturers and suppliers, the practical question is not simply whether freight costs are rising. It is which routes are exposed, how much volume is affected and whether the impact will appear through spot purchases, future contract renewals or additional inventory requirements.
PULSE tracks logistics costs across key automotive supply routes alongside raw materials, energy, labour, batteries and other production-cost drivers. This provides a consistent basis for understanding how freight movements affect the delivered cost of production in different locations.
About the data
The PULSE logistics comparison uses published container-freight indices for representative routes and destination ports. Rates are reviewed on a consistent basis to identify changes in international shipping costs and route-level divergence.
Quoted freight indices may exclude inland transport, terminal charges, surcharges and other elements of total delivered cost. Actual prices paid will vary according to contract terms, shipment volume, equipment type, carrier and service requirements.
Data shown are the latest available at the stated cut-off date and do not constitute a freight quotation or shipping recommendation.